Test page for displaying interactive Lake Data.
Option 1, using “Chart” block with Data from a CSV file.
Secchi Disc Depths
Secchi Depths
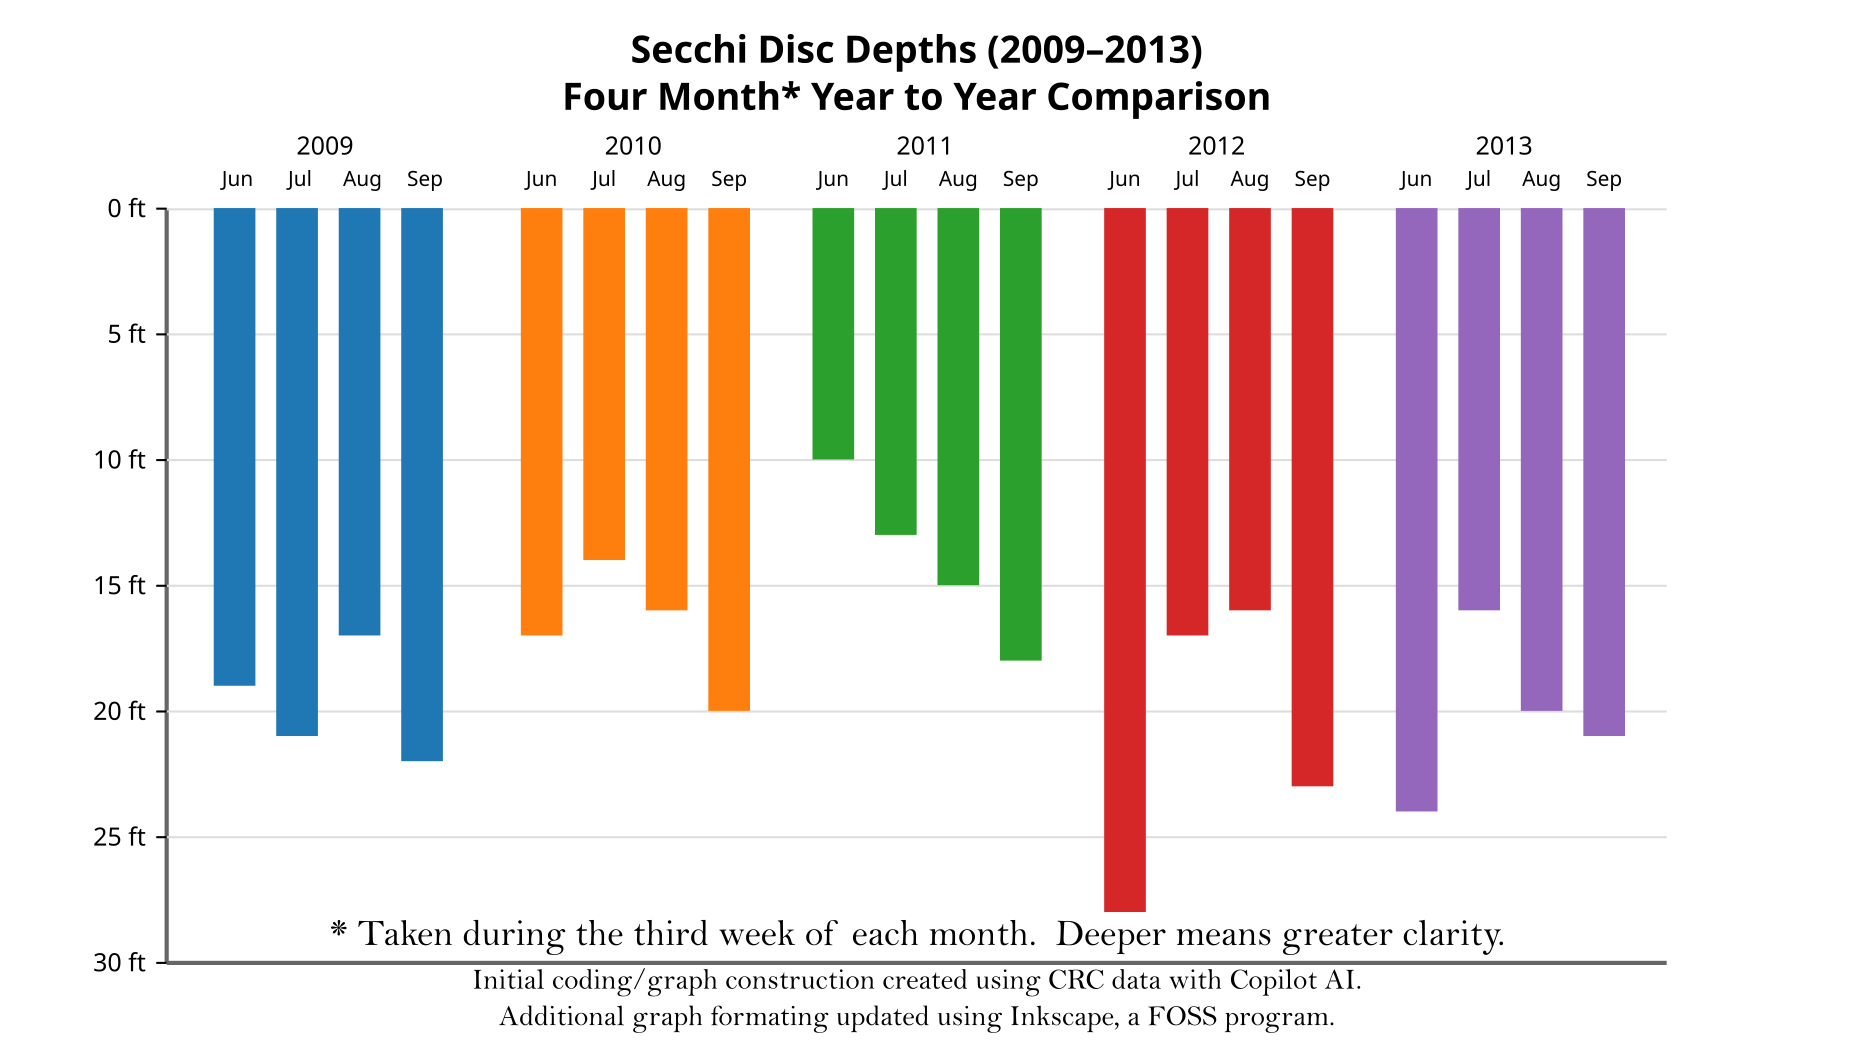
Option2: Graph Images (using scalable vector code, created using Copilot AI and then updated using Inkscape (a free, open source vector graphic editor program) to enhance initial graphs.
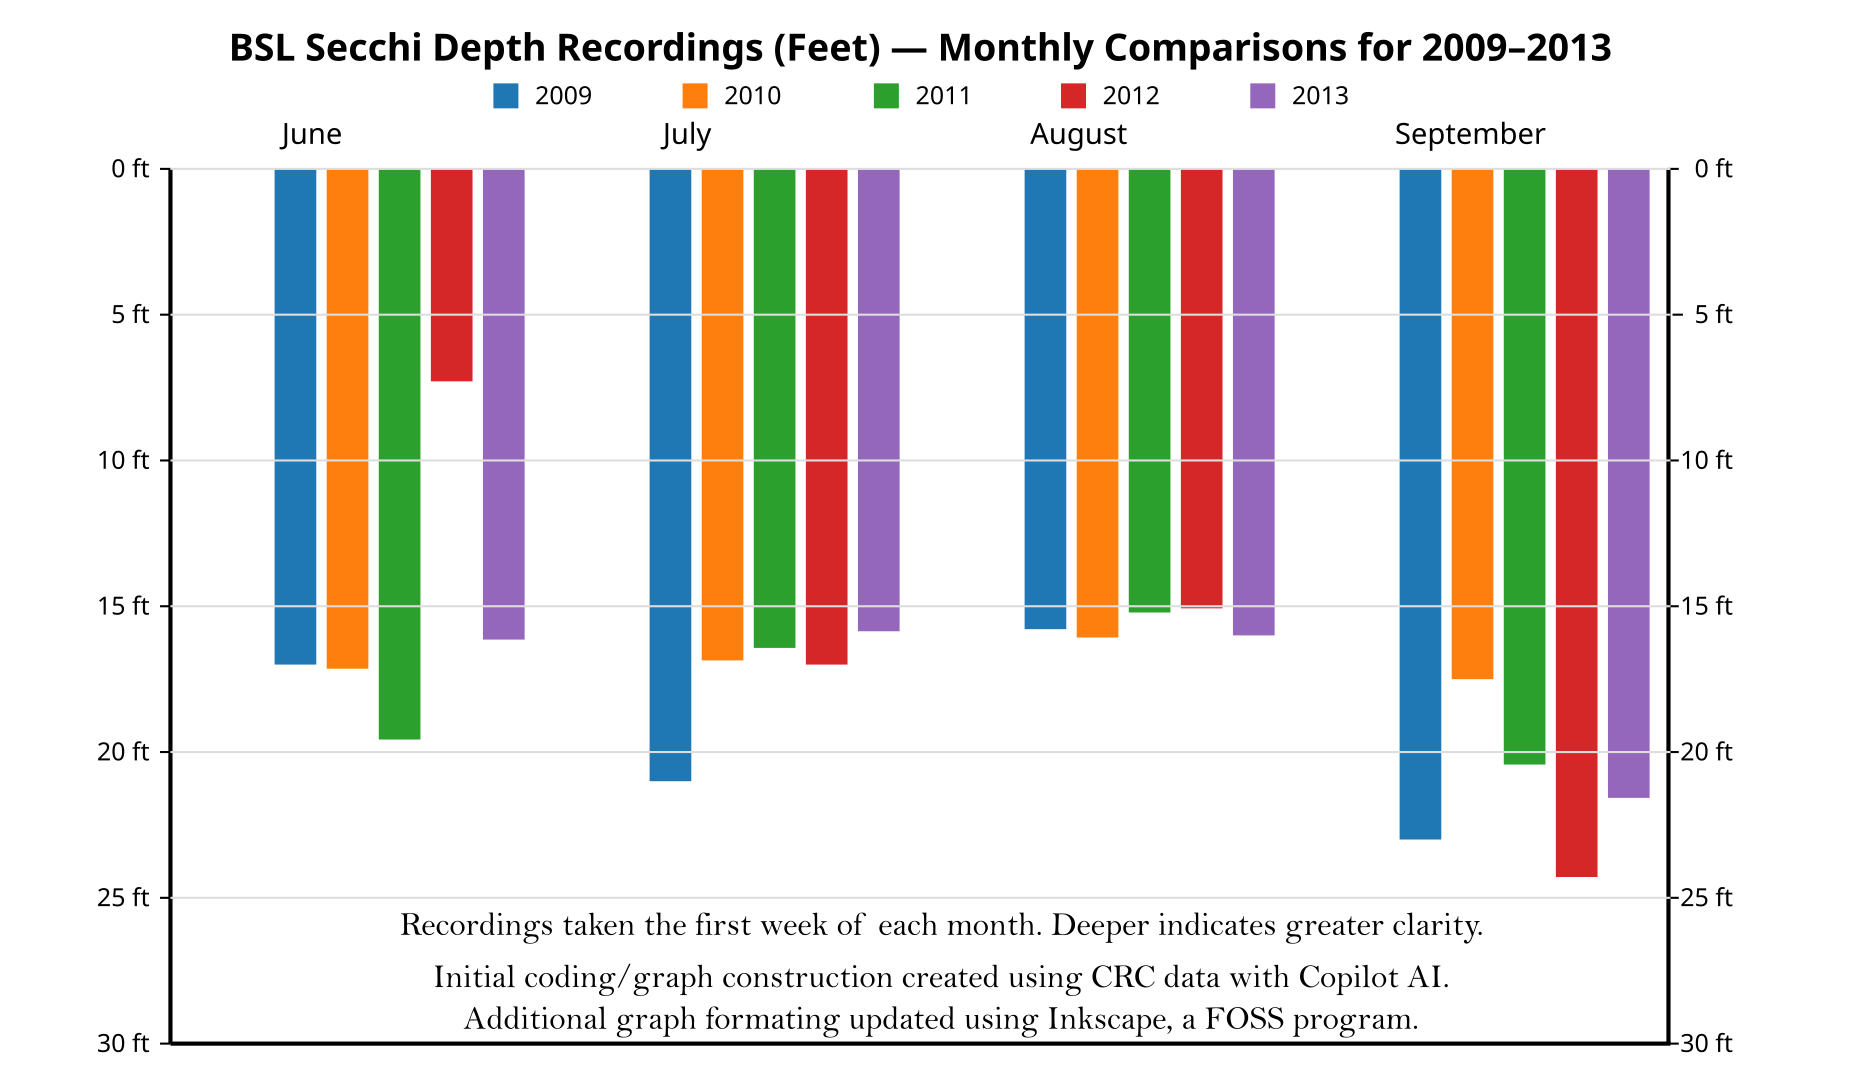
Analysis/details could be added to provide context.
Analysis/details could be added to provide context.
Option 3 - using Code, created by Copilot AI to display comparison data over several months/years etc.