Clearwater Lakes Information
Disclaimer: For a general intro to lake ecology and a list of terms used below, check out the CLA home page.
~ Salmon Lake ~

Salmon Lake in the autumn. Photo by J. Harrits

Figure 1: Location of Salmon Lake within the Clearwater Watershed
About Salmon Lake
Salmon Lake is a natural, glacially formed lake, one of several along the course of the Clearwater River. This long, slender lake is located south of Big Sky Lake, along Highway 83 (Figure 1). With a maximum depth of approximately 65 feet, Salmon Lake’s 660 acres are home to a variety of fish including:
Native:
Mountain whitefish
Cutthroat trout
Bull trout
Introduced:
Rainbow, brown, and brook trout
Largemouth bass
Kokanee salmon
Yellow perch
Past Monitoring
Seeley and Salmon Lakes have been the focus of water quality concerns in the past. In 1996, both lakes were listed for water quality impairment, but removed from listing by MTDEQ in 2006, citing a general improvement in nutrients, dissolved oxygen, and Secchi transparency. These lakes’ water qualities were also of concern in the 1970’s when heavy logging and other industrial activities influenced our watershed.
Although water quality has improved in the decades following the EPA listings, continual monitoring is an important step in understanding the lake conditions and how they continue to change. Based on CRC’s monitoring work, we know that Salmon Lake has moderate levels of algae and plant growth. It consistently has Secchi depth measurements between 10 and 20 feet at all four sites that have been monitored over the past decade (Figure 2). Salmon and Seeley Lake are the largest lakes in our watershed, and have comparable clarities, with mean annual Secchi disk measurements usually between the oligotrophic and eutrophic clarity boundaries, leaning more towards an oligotrophic classification (Figure 2).
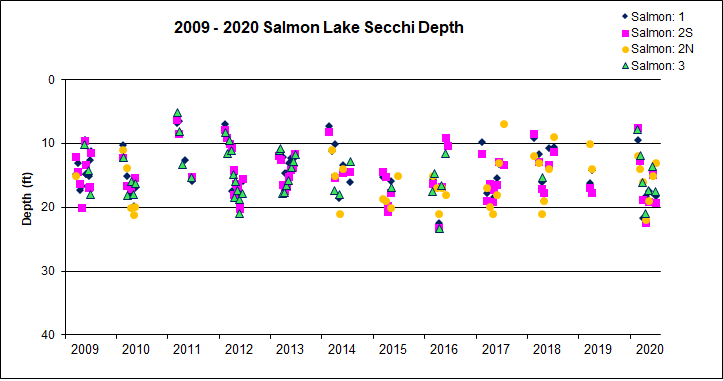
Figure 2: Secchi transparencies (depth) recorded at four sites in Salmon Lake, 2009 through 2020. See Rieman et al. (2014) for a map of locations.

Figure 3 Secchi depths recorded at 15 sites on 8 lakes in the Clearwater Watershed, 2009 through 2019. The red and green lines represent the bounds for transparencies considered indicative of eutrophic and oligotrophic conditions, respectively. Note that as of 2020, Clearwater and Rainy Lakes were omitted from monitoring.
Dissolved oxygen (DO) data has been collected on Salmon Lake sporadically over the past few decades (Figure 4). Dissolved oxygen data are extremely important in giving us an idea of the influence that humans are having on our lakes. In 2020, CRC undertook DO monitoring on Salmon Lake to give us a better idea of current conditions and whether water quality is declining. In addition to Salmon Lake, DO profiles were taken on 5 other lakes in our watershed (Placid, Seeley, Big Sky, Alva, and Inez) on a monthly basis throughout 2020 to establish a baseline DO dataset.

Figure 4: Dissolved oxygen (mg/L) depth profiles at one site on Salmon Lake in 2010 and 2014.
An analysis was previously completed for Salmon and Seeley Lakes in 2012 by Vicki Watson of the University of Montana in her report, titled “Lake Water Quality, Trophic Status, and Potential Loading Sources for Clearwater Lakes”. In the report, Watson explains that temperature and DO depth profiles from the summer of 2010 were used to assess patterns of thermal stratification in these two lakes. Salmon Lake did not appear to be strongly stratified until mid-July, but DO levels dropped drastically in waters below 8-10 meters by as early as mid-June. By mid-August to early September 2010, waters in Salmon Lake below 8-10 meters were approaching anoxic conditions. Both lakes were still well stratified in early September but had turned over by the end of October.
State water quality standards for dissolved oxygen to protect freshwater aquatic life in most Montana waters is 5 parts-per-million (ppm) as a 7-day-mean minimum. If early life stages are present, the 7-day-mean standard is 9.5 ppm. Two sites monitored on Salmon Lake had DO levels below 5 ppm below 10 meters as early as mid July (Figure 4). By August and September, this 5 ppm level had moved up to 7-8 meters deep (Figure 4).

Figure 5: Dissolved oxygen (mg/L) profile recorded at the two northern sites in Salmon Lake, from July through September 2020.

Figure 6: Dissolved oxygen (mg/L) profile recorded at the two southern sites in Salmon Lake, from July through September 2020.
In contrast to many of the other lakes in 2020, Salmon Lake had its highest oxygen levels above the thermocline (the depth at which dramatic change in temperature occurs) in September, followed by August, and then July (Figures 5 and 6). The two northern sites (1 and 2N) consistently had higher oxygen levels than the southern sites (2S and 3). The inlet (at the northern end of the lake) most likely provides the northern sites with more oxygen through water movement. Site 3 is located in the southernmost bay of the lake. The lake narrows just north of this site, which likely decreases water movement in this bay, making it more stagnant. Although the 4 deep spots on Salmon Lake are shallower than many of those in the other lakes (at about 15-18 meters), the oxygen decreased to approximately 0 by about 12-14 meters in a few instances. However, similar to Big Sky Lake, the deep spots on Salmon are quite small in area, and the influence of wind often impacted the readings, as the small boat used on Salmon Lake was easily pushed by the wind and current away from the exact sampling location. In the future, an anchor should be used to ameliorate this limitation in data collection. Nevertheless, the oxygen sag is quite pronounced, and likely concerning for aquatic life, especially in August and September.
Current and Future Monitoring
Water Quality
Drawing further conclusions based upon the sporadic data that currently exists prior to 2020 is difficult, but as Watson’s reporting shows, monitoring is necessary, especially in these water bodies that have been affected by anthropogenic pollution in the past. More consistent measurements are needed to better assess the status of each lake in the valley.

Figure 7: Water quality monitoring sites on Seeley Lake in 2021.
In 2021, CRC is collecting data on DO, conductivity, algae, nutrient, and pH conditions on Salmon Lake (as well as Alva, Inez, Big Sky, Placid, and Seeley) in order to continue establishing baseline data to aid in future water quality analyses. We will also be analyzing data to evaluate the health of our aquatic ecosystems in the Valley. This includes looking for trends in Nitrogen and Phosphorous levels, presence of E. coli bacteria, evidence of oxygen depletion, growth of potentially toxic algae, and other changes to the waterbodies in the Clearwater Watershed.
A new addition to the monitoring process this year is a multiparameter water quality monitoring instrument. This new piece of equipment was recently purchased thanks to a Bureau of Reclamation WaterSMART grant. It uses sensors to accurately read and record levels of conductivity, algae, and pH as deep as 30 meters (~100 feet) in our lakes. Such data is integral to determining the health of our lakes here in the Clearwater Watershed and can aid in detecting harmful algal blooms and habitat degradation.
Check back in the winter for results and findings from our monitoring season!
Algae

Toxic Blue Green Algae, (10/20)
Photo by J. Harrits
Salmon Lake is being watched on a yearly basis is the appearance of toxic blue green algae. This has been found occasionally in the past, with the most recent observation in October 2020. Read the Seeley Swan Pathfinder article (10/8/20), “Algae bloom reported on Salmon Lake, may be toxic” to learn more.
The cause of harmful algal blooms is still unknown, however certain water conditions such as high nutrient levels, warm temperatures, and decreased water flow can increase the frequency of toxic algae growth. Toxic blooms can occur naturally, but the number of blooms has been increasing globally in recent years due to human impacts on aquatic ecosystems. Additional information on toxic algae blooms can be found at:
(CRC Webpage)
Toxic Algae in Montana
(FAQ data sheet by MT DPHHS website & MT DEQ)Freshwater Harmful Algal Blooms 101
(Natural Resources Defense Council, NRDC website)
Aquatic Invasive Species (AIS)
Zebra and Quagga Mussels

Figure 8: 11 lakes in the Swan, Clearwater, and Blackfoot drainage basins were monitored for AIS in 2020. In order, as labeled, these lakes include: Holland, Lindbergh, Alva, Inez, Seeley, Placid, Big Sky, Salmon, Upsata, Coopers, and Browns.
CRC has been monitoring for invasive species in the Clearwater Watershed throughout the summers since 2009 on each of the major lakes in the Valley (Alva, Inez, Seeley, Salmon, Placid and Big Sky). One of the biggest threats to Montana’s waterways is the introduction of zebra and quagga mussels, collectively referred to as dreissenid mussels. The purpose of our AIS program is to monitor for the presence of veligers in the lakes by straining large volumes of lake water through a fine mesh net to collect planktonic and microscopic materials in the lake water, including mussel veligers, if present. Veligers are the free-swimming, microscopic juveniles of zebra and quagga mussels. Over the course of the 2020 field season, 62 total sites, spread out over 11 lakes (Figure 6), were sampled each round, totaling 310 samples.
We are happy to report that zebra and quagga mussel veligers were undetected in all of the samples collected and analyzed in 2020. We continue to monitor for zebra and quagga mussel veligers throughout 2021 on the six major lakes in the Valley.
Fragrant Waterlilies
Another problematic invasive species in the Clearwater Watershed is the non-native Fragrant Waterlily. The Fragrant Waterlily was likely introduced to the region as an ornamental plant, but has since experienced exponential population growth. The mats of these waterlilies are detrimental to aquatic habitat and outcompete native plant species. Fragrant waterlilies can also cause oxygen depletion, which negatively affects native fish and amphibian species. In 2020, the Missoula County Weed District mapped the waterlilies on the major lakes in the Clearwater, recording a total of 5.2 acres of the species on Salmon Lake.
In 2020, CRC’s first annual Make-the-Cut event took place on Salmon on Placid Lakes. In 2021, CRC held lily digging and cutting events at various locations on Seeley Lake in an effort to remove the invasive species. We hope to hold events such as these at more lakes in the Clearwater Valley in upcoming years.
Through CLA, we hope to involve more residents in our citizen science Adopt-a-Lake program to expand the parameters we monitor and increase our monitoring frequency. CLA will also help us to take steps to actively improve the water quality of the lakes, which over time will hopefully be evident through the monitoring data we collect.
Establishing baseline monitoring data through our Adopt-a-Lake program is only the start. Contact CRC’s Jon Haufler ( jon@crcmt.org) to learn more about current efforts and/or how you can get involved.
Return to Clearwater Lakes Alliance main page.

CRC Adopt-A-Lake volunteer out on Salmon Lake.